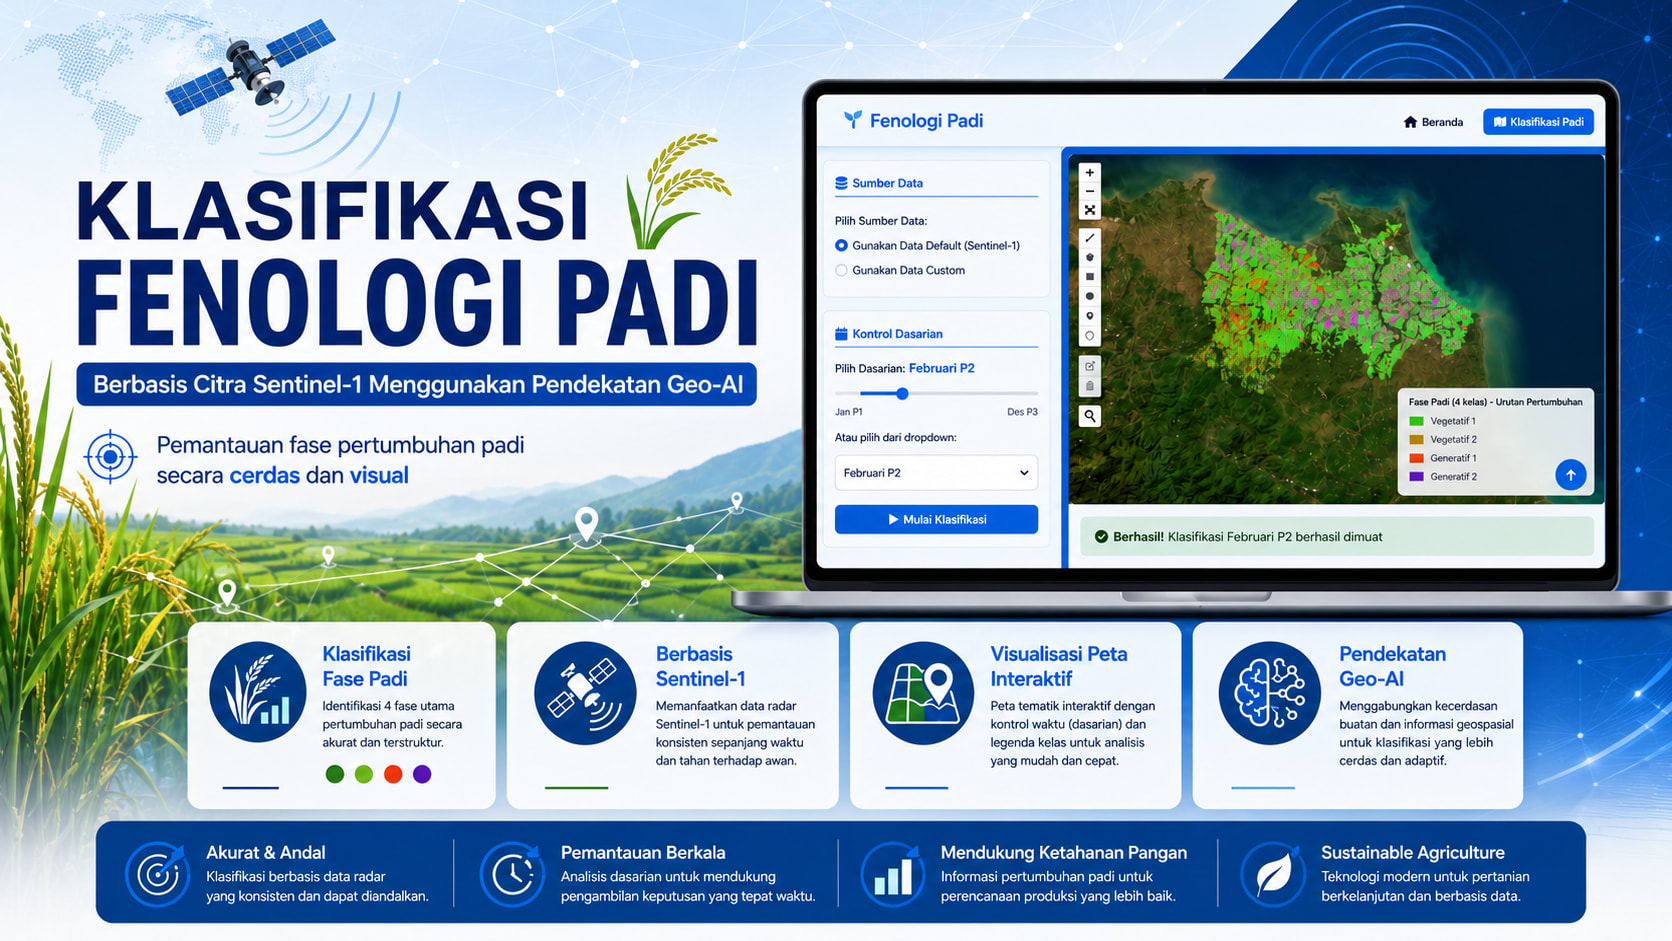
Rice Phenology Classification Based on Sentinel-1 Using a Geo-AI Approach
Rice phenology classification system based on Sentinel-1 imagery using a Geo-AI approach, Python, Random Forest, and Flask API, achieving 87% accuracy to support automated rice growth-stage analysis.
View Live ProjectShare this:
1. PROJECT OVERVIEW
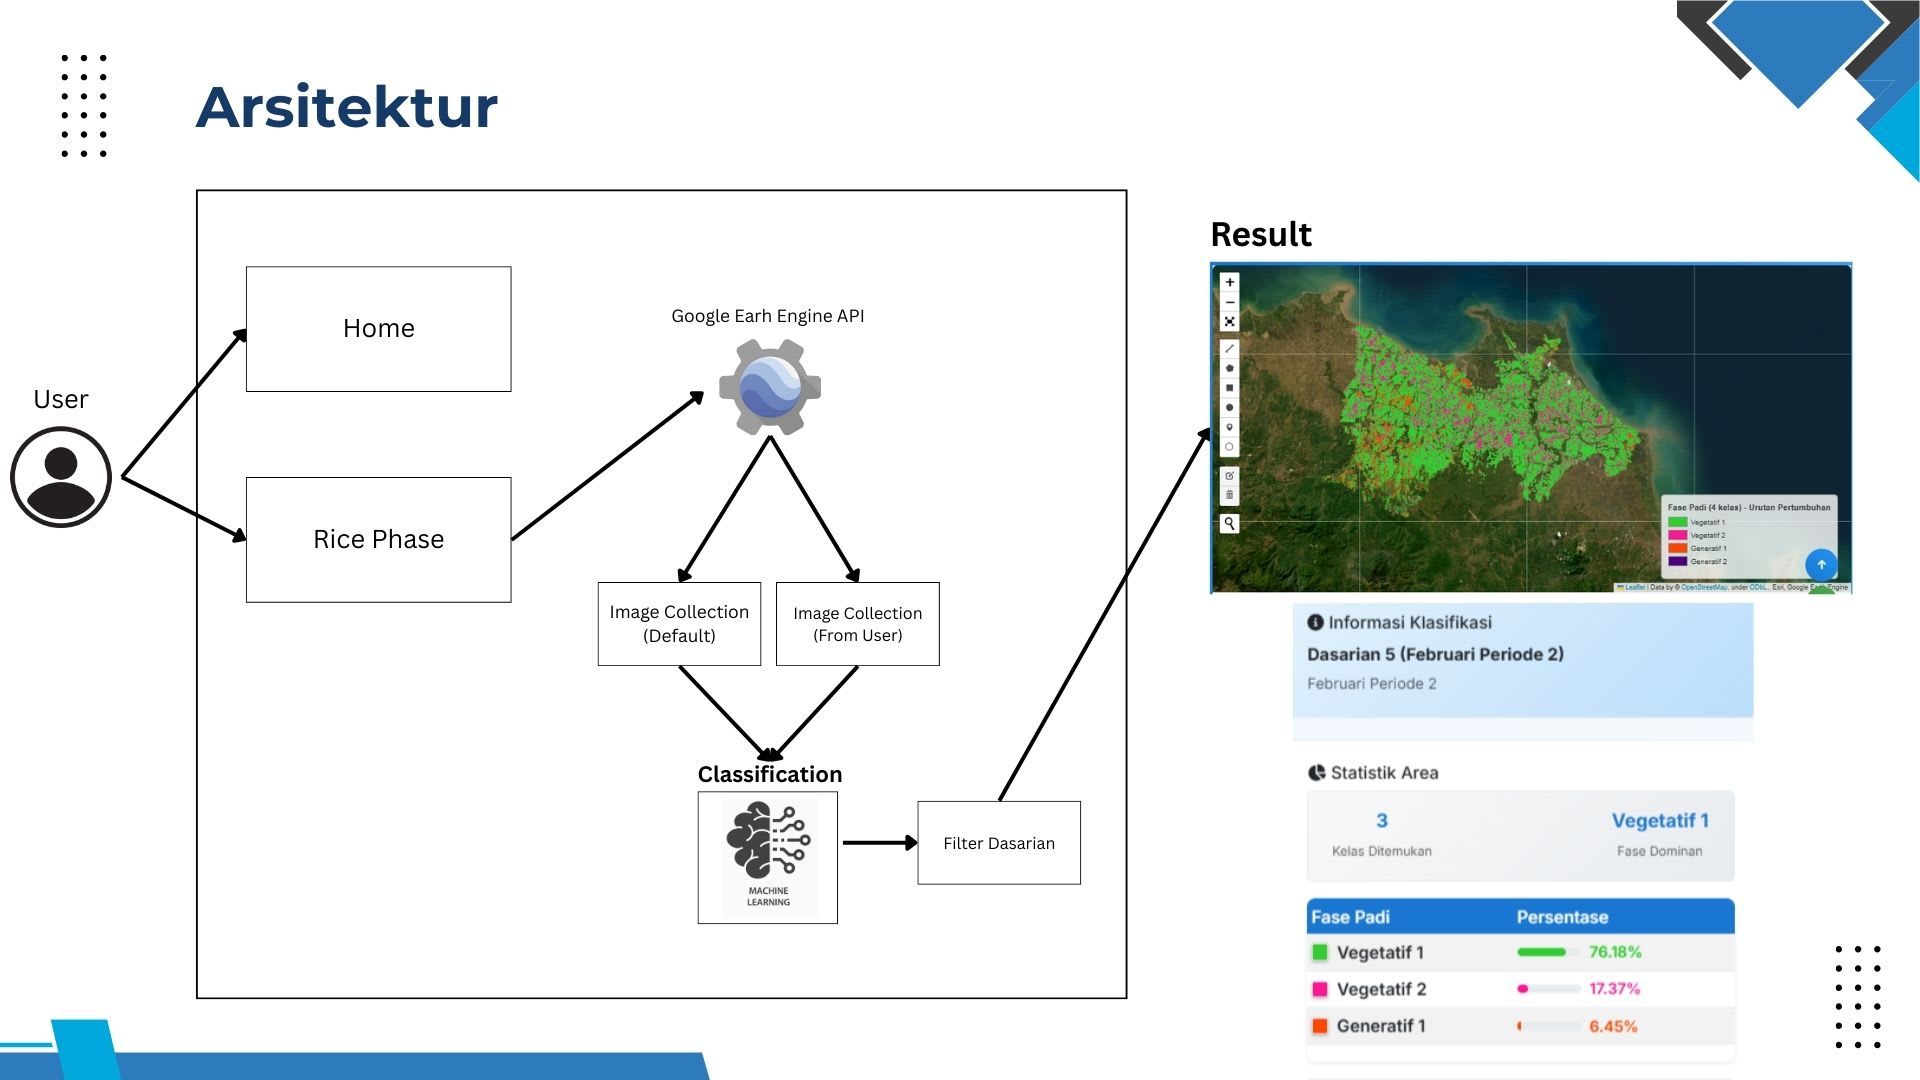
This project is a web application developed to classify rice growth phases using Sentinel-1 SAR imagery and the Random Forest algorithm. The application uses Google Earth Engine for geospatial data processing and displays the classification results through an interactive map.
2. CASE STUDY AND SCOPE
The project focuses on monitoring rice growth phases in Indramayu Regency, West Java.
The project scope includes:
Classification based on ten-day periods or custom date ranges.
Sentinel-1 imagery processing through Google Earth Engine.
Classification of four rice growth phases.
Calculation of the area and distribution of each phase.
Visualization of classification results through an interactive map.
Comparison of rice growth phase changes across different periods.
3. TECHNOLOGY STACK
Python and Flask: Web application backend.
Google Earth Engine: Satellite imagery and geospatial data processing.
Random Forest: Rice growth phase classification model.
Sentinel-1 SAR: Radar satellite imagery data source.
Geemap and Folium: Interactive map visualization.
Pandas and NumPy: Data processing and numerical operations.
HTML, CSS, Bootstrap, and JavaScript: Application user interface.
4. METHODOLOGY
Sentinel-1 data is processed through several stages, including noise reduction, correction, calibration, and radar index calculation. The features used include VV, VH, RPI, API, NDPI, RVI, and incidence angle.
The dataset is then divided into training and validation sets to develop the Random Forest model. The model is used to classify rice growth phases, calculate the area of each class, and display the results on an interactive map based on the period selected by the user.