Data Warehouse Fakultas Sains Institut Teknologi Sumatera
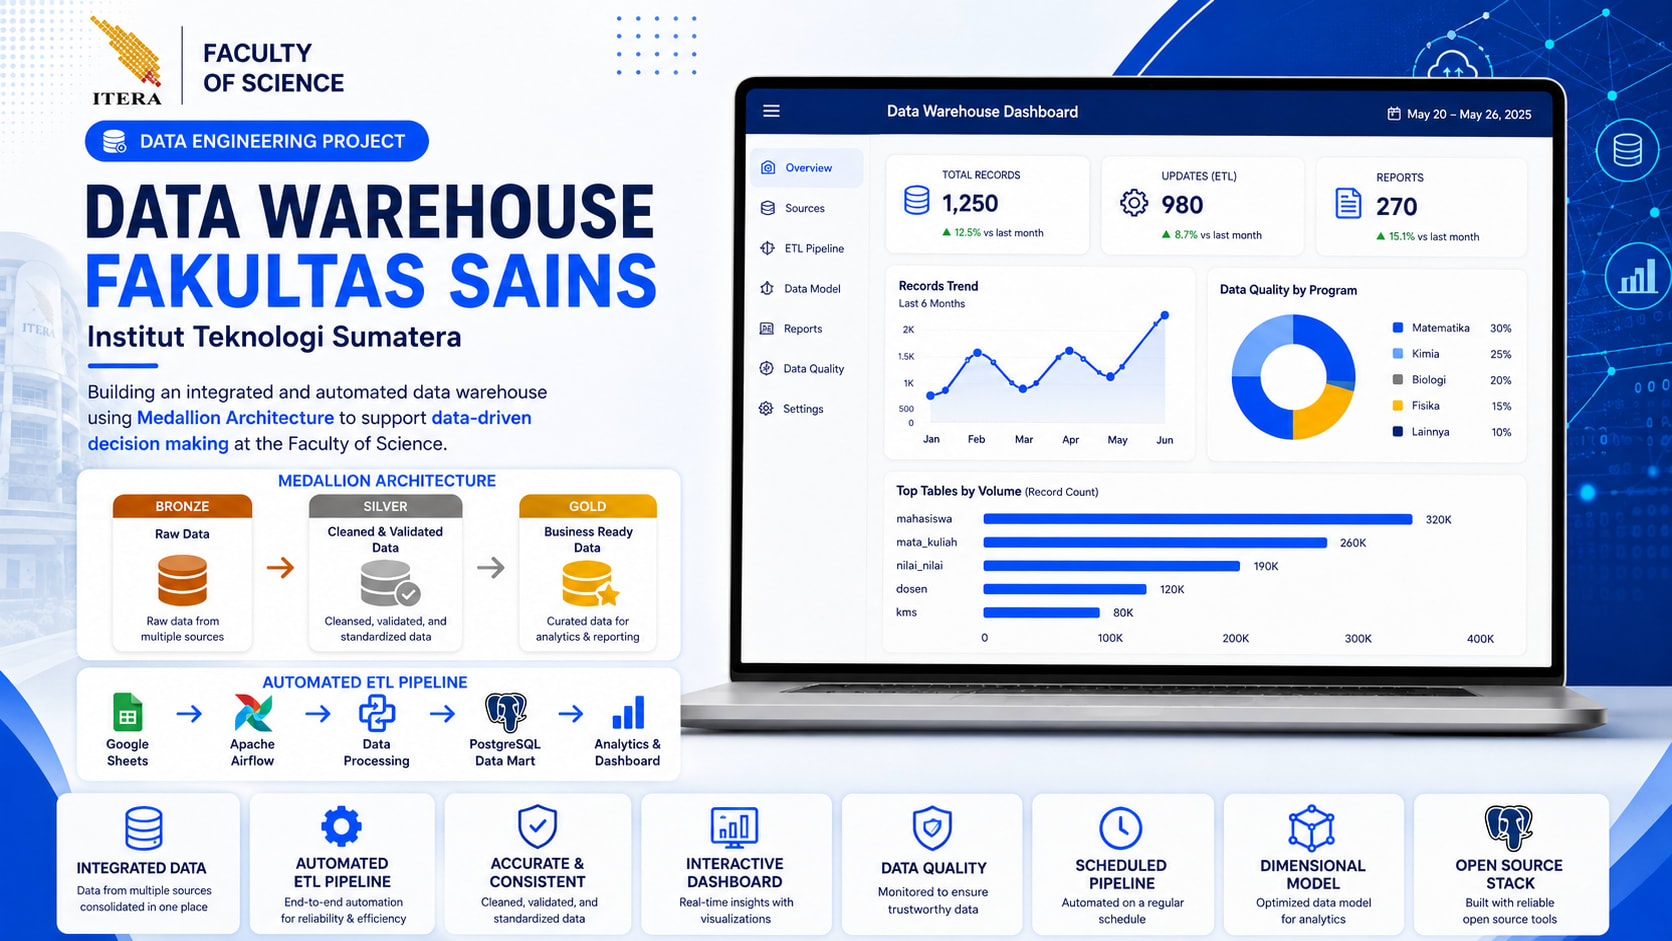
Faculty of Science Data Warehouse is a data engineering project designed to build a centralized data integration system based on Medallion Architecture. This system processes data from multiple sources through an automated ETL pipeline, stores the data in a PostgreSQL Data Mart, and presents analytical insights through an interactive Apache Superset dashboard to support data-driven decision-making
View Live ProjectShare this:
1. PROJECT OVERVIEW
This project is a data mart system developed to integrate and process student service request data at the Faculty of Science, Institut Teknologi Sumatera.
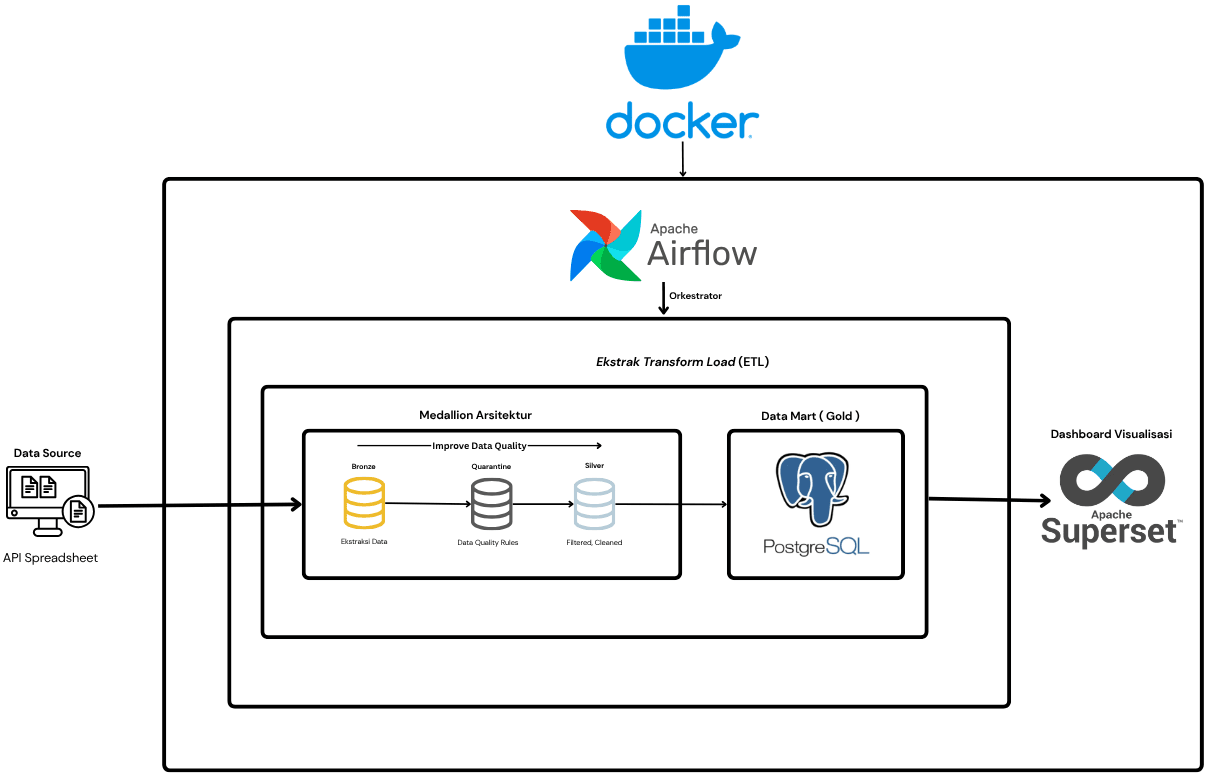
The ETL pipeline was built using Apache Airflow to extract data from multiple Google Sheets, perform data validation and transformation, and load the final results into PostgreSQL in the form of dimension and fact tables.
The system architecture adopts the Medallion Architecture approach, which divides data processing into three main layers: Bronze, Silver, and Gold. Data from the Gold layer is then used by Apache Superset to build analytical dashboards and support data-driven decision-making.
The main DAG in this project is scheduled to run automatically every hour.
2. CASE STUDY AND SCOPE
The case study of this project focuses on managing student administrative service request data at the Faculty of Science, Institut Teknologi Sumatera.
Previously, the service data was stored across multiple sources, including Google Sheets, with potentially different structures and formats. This condition made the processes of data integration, validation, monitoring, and analysis more difficult.
This project was designed to integrate the data into a structured data mart system.
The project scope includes:
Extracting student service data from multiple sources, including Google Sheets.
Storing raw data in the Bronze layer in CSV format.
Validating column structures, data formats, values, and duplicate records.
Cleaning and standardizing the data before it is used for analysis.
Separating valid and invalid data.
Storing valid data in the Silver layer.
Storing problematic data in the Quarantine layer.
Loading Silver-layer data into PostgreSQL under the
datamartschema.Creating dimension and fact tables.
Running the pipeline automatically using Apache Airflow.
Monitoring the ETL process through Airflow.
Connecting PostgreSQL to Apache Superset.
Providing dashboards for student service analysis.
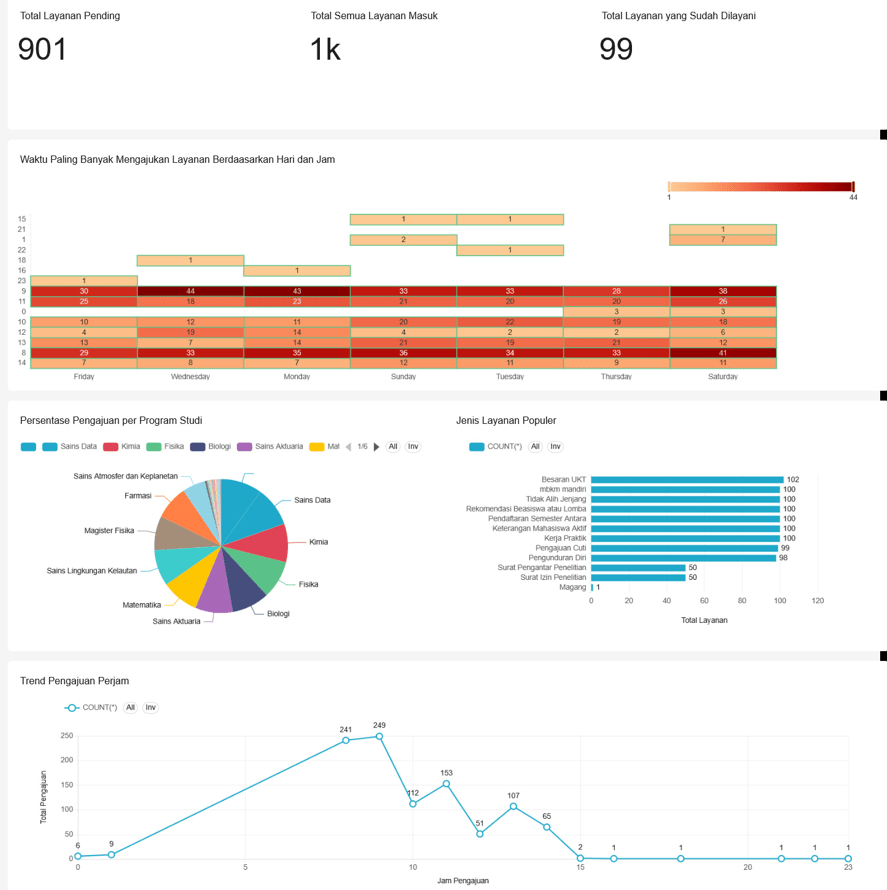
The developed dashboard includes KPIs and visualizations such as the total number of service requests, completed services, pending services, and service distribution by academic program, service type, status, and time period.
This project focuses on data integration, processing, storage, and visualization. The system does not yet include the development of an operational application for students to submit service requests directly.
3. TECHNOLOGY STACK
Apache Airflow
Used to orchestrate the ETL pipeline, run processes on a defined schedule, manage dependencies between tasks, and monitor the status of each process through DAGs.
Google Sheets API
Used to access and retrieve student service request data from multiple Google Sheets spreadsheets as the primary data sources.
Python
Used as the primary programming language for developing the data extraction, transformation, validation, and loading processes.
Pandas
Used to read, combine, clean, validate, and transform data before it is loaded into the data mart.
PostgreSQL
Used as the database management system for storing the Gold layer in the form of the datamart schema, dimension tables, and fact tables.
Apache Superset
Used as the business intelligence layer for developing dashboards, KPIs, visualizations, and data exploration based on data stored in PostgreSQL.
Redis
Used as the message broker in the Celery Executor configuration, allowing Airflow tasks to be distributed and processed by workers.
Docker Compose
Used to run the entire project stack locally, including Airflow, PostgreSQL, Redis, workers, the scheduler, and other supporting components.
CSV
Used as temporary storage for the Bronze, Silver, and Quarantine layers before the data is loaded into PostgreSQL.
4. METHODOLOGY
The data processing methodology used in this project follows the Medallion Architecture approach, which consists of the Bronze, Silver, and Gold layers.
4.1 Data Extraction
Apache Airflow runs tasks to retrieve data from multiple Google Sheets using the Google Sheets API.
Each spreadsheet represents a different type of student service. Data from each source is extracted and forwarded to the pipeline for further processing.
4.2 Bronze Layer
Data obtained from the source systems is stored in the data/bronze/ folder in CSV format.
At this stage, the data is preserved in its raw form and has not undergone significant cleaning or transformation. The Bronze layer serves as the initial storage area and archive for source data.
4.3 Data Quality Validation
Data in the Bronze layer is evaluated using several data quality rules, including:
Completeness of values in mandatory columns.
Conformity of column names and structures.
Validity of date and time formats.
Validity of service status values.
Consistency of text formats.
Detection of duplicate records.
Identification of values that do not comply with business rules.
The validation process ensures that data forwarded to the next stage meets the defined data quality standards.
4.4 Silver Layer
Data that passes all validation rules is cleaned, standardized, and stored in the data/silver/ folder.
At this layer, the data format has been standardized, making the data more suitable for database loading and analytical processes.
4.5 Quarantine Layer
Data that fails to meet the validation rules is separated and stored in the data/quarantine/ folder.
The Quarantine layer ensures that problematic data is not immediately discarded. The data can be reviewed, corrected, and reprocessed without affecting valid data in the Silver layer.
4.6 Gold Layer
Data from the Silver layer is loaded into PostgreSQL under the datamart schema.
The data is organized using a dimensional model consisting of dimension and fact tables. The dimension tables store descriptive information, such as students, service types, service statuses, and time. The fact table stores student service request activities along with foreign keys that connect each dimension.
The Gold layer contains structured final data that is ready for analytical purposes.
4.7 Orchestration and Scheduling
The entire ETL process is managed through an Apache Airflow DAG.
The DAG runs automatically every hour, starting from data extraction, Bronze-layer storage, validation, Silver-layer transformation, Quarantine separation, and data loading into PostgreSQL.
Airflow is also used to monitor the success or failure of each task within the pipeline.
4.8 Data Visualization
Apache Superset is connected directly to PostgreSQL as the visualization layer.
Data within the datamart schema is used to create KPIs, trend charts, academic program distributions, service status visualizations, and service request summaries by service type and time period.
This integration allows data in the Gold layer to be analyzed without modifying the main ETL pipeline.
4.9 Monitoring and Evaluation
The pipeline is monitored through the Apache Airflow interface to review DAG statuses, task durations, execution logs, and potential failures.
Evaluation is also conducted based on the number of source records, valid records, quarantined records, successfully loaded records, execution time, and the overall ETL success rate.